Operating Portfolio Overview

Direct solar assets:
- 92 UK solar assets totalling 866MW (100% owned by NESF)
- 8 Italian solar assets totalling 34MW (100% owned by NESF)
Co-investment solar asset:
- 1 Spanish solar co-investment totalling 50MW (24.5%owned by NESF)
- 1 Portuguese solar co-investment totalling 210MW (13.6% owned by NESF)
Standalone energy storage asset:
- 1 standalone energy storage assets totalling 50MW (70% owned by NESF)
Private International Solar Infrastructure Investment:
- $50m investment into NPIII (6.21% owned by NESF)
- Portfolio is fully invested with a total capacity of 1.6GW (636MW operational) across USA, Chile, Italy, Portugal, Spain, India, Poland and Greece.
Portfolio Performance
The Company’s operating assets are actively managed by WiseEnergy which oversees the technical, commercial and financial operations across the portfolio’s assets. WiseEnergy provides value to shareholders by optimising operating asset performance through maximising revenue, minimising risk, and reducing operating expenses where possible.
During the period, generation performance was impacted due to adverse weather conditions and higher than anticipated distribution network operator outages, both of which are outside of the Company’s control.
Generation was affected by two principal factors:

1. Adverse Weather
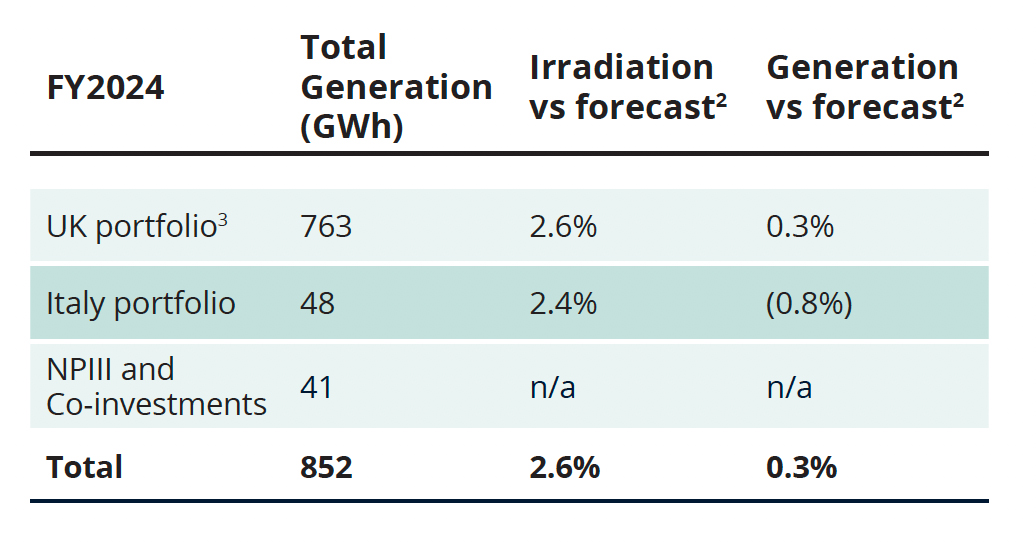
Although solar irradiation across the NESF portfolio was 2.6% above acquisition forecasts, the UK recorded one of its wettest seasons on record during the financial period. The Met Office reported that in England and Wales, where the vast majority of NESF assets are located, rainfall was 32% above the 1991-2020 average. This created operational challenges for parts of the portfolio, including temporary flooding in isolated parts of assets, increased humidity (which can affect the performance of certain components) and component failure necessitating repair or replacement.
2. Grid /Distribution Network Operator (“DNO”) Outages
DNOs are regionally based licensed companies (there are seven across the UK) with each responsible for a specific region of the GB electricity network. To ensure safety of their engineers and others, DNOs periodically take parts of the electricity network offline to enable completion of a rolling programme of preventative maintenance, upgrade and associated works. Adverse weather conditions can also result in unplanned outages on the DNO networks. During these periods of outage, electricity cannot be exported onto the network.


Despite these adverse operating conditions, full-year generation was 0.3% above budget (2023: 5.5% above budget), due to the proactive management of the operating portfolio over the year. The Company continued to generate cash flows in line with its target range, providing a healthy dividend cash-coverage of 1.3x for the period demonstrating the resilience of the Company’s portfolio (1.4x for 31 March 2023). To further enhance the Company’s portfolio performance the Investment Adviser and the Asset Manager have a rolling strategic re-investment programme which regularly reviews the Company’s portfolio’s performance to identify opportunities to support and enhance long-term asset health1.

This proactive strategy to risk mitigation helps secure and underpin both dividend commitments and dividend cover, whilst reducing volatility and increasing visibility of cash flows.