Cash Flow Generation

The NESF Group generates revenues through the sale of electricity to the markets and the subsidies provided under various subsidy regimes (ROC, NIROC and FiT). Both revenue streams are underpinned by two main factors:
- The actual energy generated (measured as the amount of GWh of energy generated), which is mainly driven by the solar irradiation, technical performance and availability of the plant; and
- The actual price at which the energy generated is sold to the markets, as well as the subsidies received for the same generation.
The performance of a plant in terms of revenues is therefore a product of both the operational performance and the commercial terms of the PPAs in place. Before taking into account tax payments and financing considerations, the cash flow generation of solar assets is also influenced by operating expenses, which are usually governed by long-term contracts and characterised by low volatility over the long-term.


Operating Results

Operating Expenses and Ongoing Charges
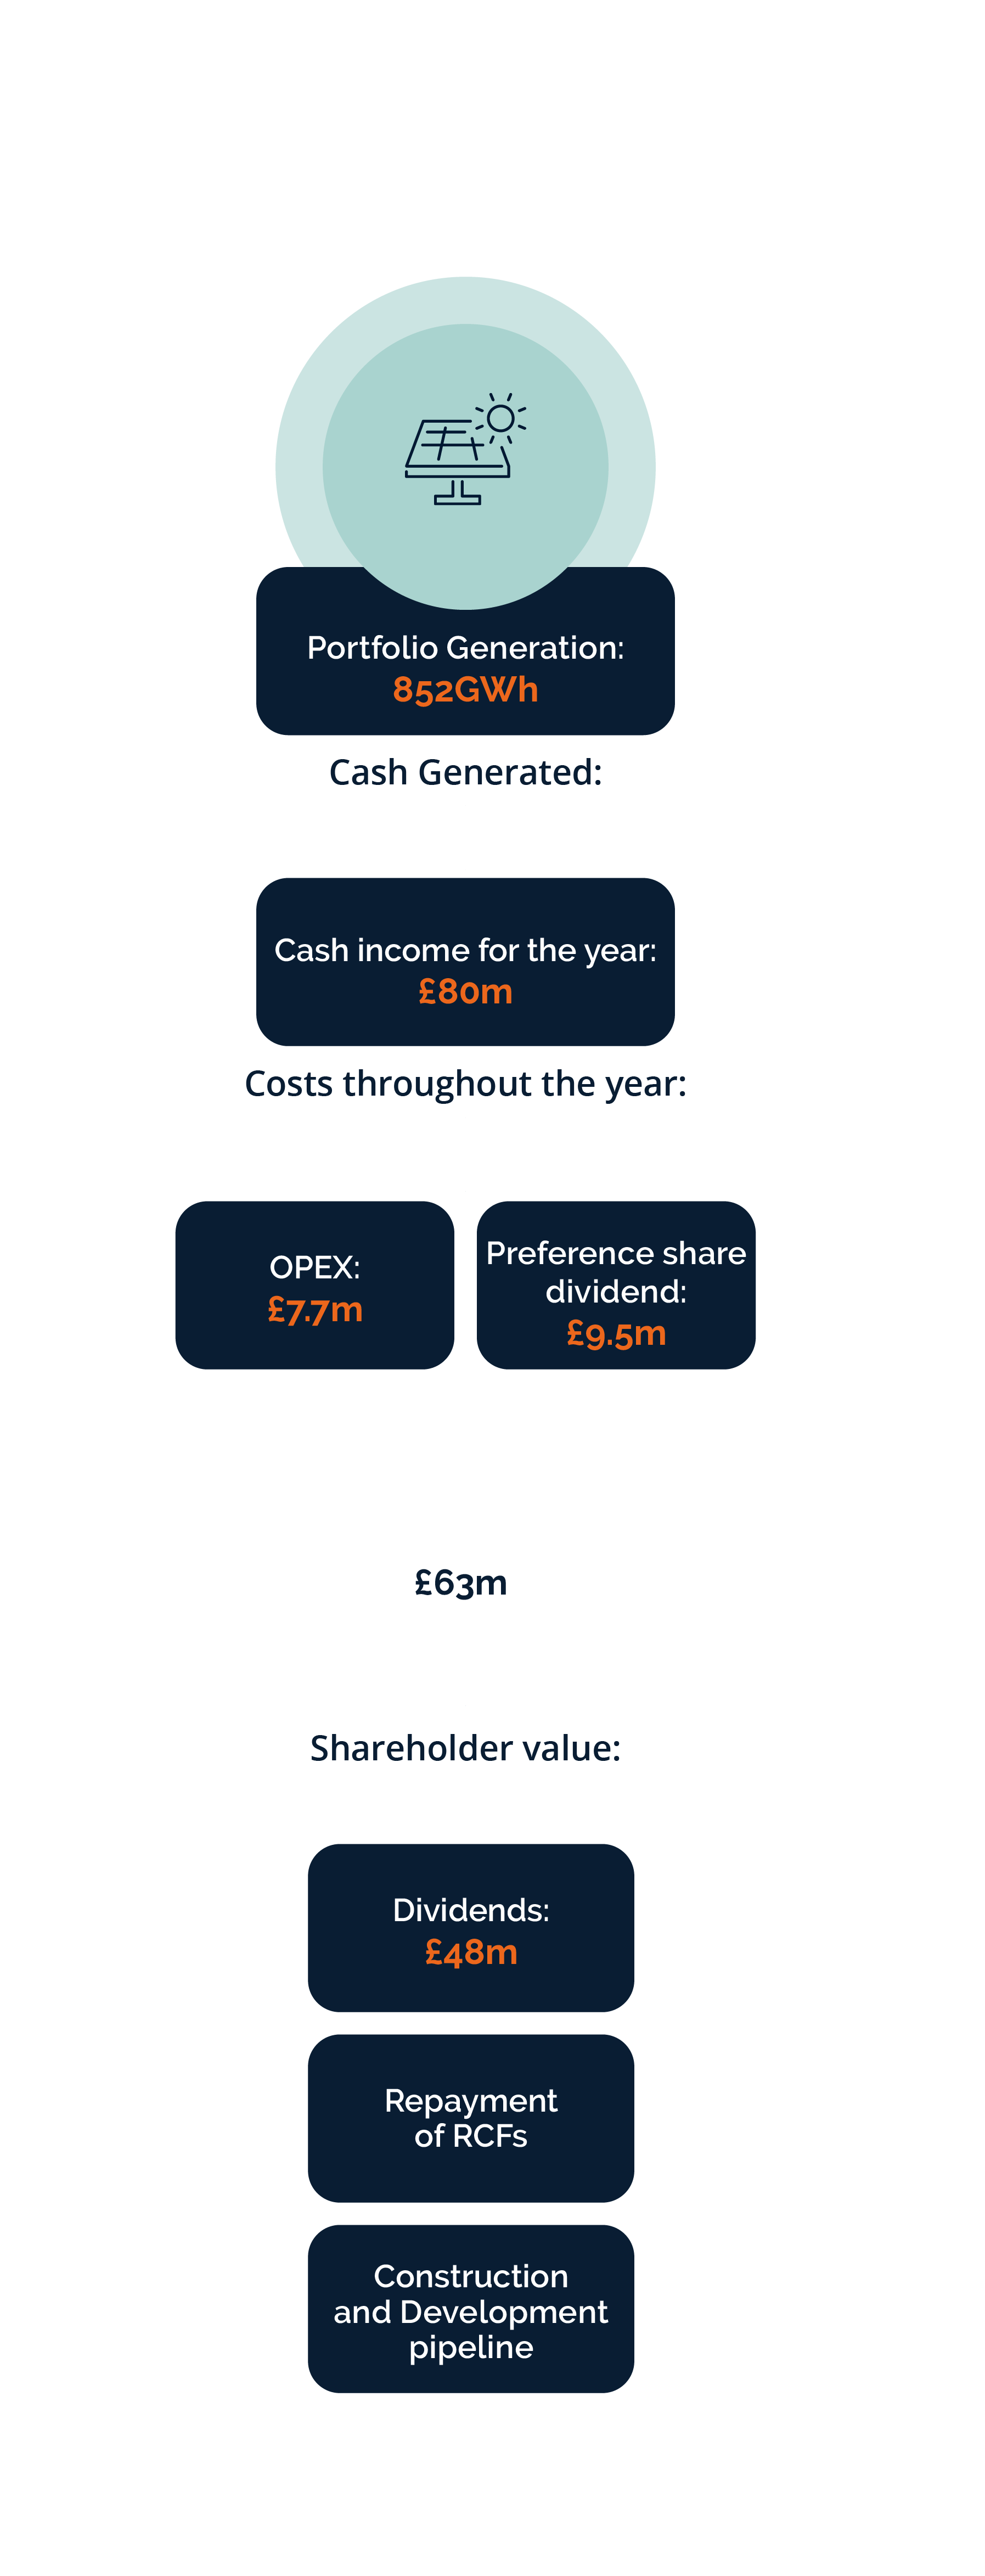
The operating expenses, excluding preference share dividends paid by the Company, for the year amounted to £7.7m (2023: £8.2m). The Company’s ongoing charges figure was 1.1% (2023: 1.1%). The budgeted ongoing charges figure for the financial year ending 31 March 2025 is 1.1%. The ongoing charges figure has been calculated in accordance with the Association of Investment Companies’ recommended methodology and is an Alternative Performance Measure.

Cash Flow Analysis
As at 31 March 2024, the Company held cash of £8.9m at an A+ credit rated financial institution (2023: £14.4m). Cash received from assets in the year covered the operating expenses, the preference share dividends, dividends declared to ordinary shareholders in respect of the year ended 31 March 2024 and part of the investment into HoldCos.